-
Best Forex Brokers
Our top-rated Forex brokers
-
Brokers for Beginners
Start trading here
-
Forex Demo Accounts
Learn to trade with no risk
-
ZAR Trading Accounts
Save on conversion fees
-
Lowest Spread Brokers
Raw spreads & low commissions
-
ECN Brokers
Trade with Direct Market Access
-
No-deposit Bonuses
Live trading with no deposit
-
High Leverage Brokers
Extend your buying power
-
Islamic Account Brokers
Best accounts for Muslim traders
-
Market Maker Brokers
Fixed spreads & instant execution
-
All Trading Platforms
Find a platform that works for you
-
TradingView Brokers
The top TradingView brokers
-
MetaTrader4 Brokers
The top MT4 brokers in SA
-
MetaTrader5 Brokers
The top MT5 brokers in SA
-
cTrader Brokers
The top cTrader brokers in SA
-
Forex Trading Apps
Trade on the go from your phone
-
Copy Trading Brokers
Copy professional traders
It’s no secret that Forex traders thrive on volatility. 2023’s rollercoaster of geopolitical instability and constantly shifting interest rate expectations caused high volatility across the major pairs; traders responded accordingly, and we saw high trading volumes all year, with spikes in March and October 2023.
Institutional Forex volume down
But 2024 has been a different story entirely. The Cboe FX exchange, which held a 20% market share in spot FX trading in 2023, has seen a huge drop in trading volumes. February marked the fourth consecutive month of decline in ADV (average daily volume), dropping to $42.6 billion—down from $46.75 billion in October. Total volume for February was $895.2 billion, compared to $959.8 billion reported in January and $1.03 trillion in October 2023.
Major European Forex exchanges reported similar drops in volume, with Deutsche Borse’s 360T and Euronext FX’s FastMatch both seeing declines in ADV and total volume. Asia was not immune either, with Click365, the Forex platform of the Tokyo Stock Exchange, reporting a decrease in turnover of 13.1% compared to January 2024 and the total volume of contracts falling by nearly 25% compared to February 2023.
Retail Forex trading also declines
So, while it’s clear that institutional Forex volumes are down, does this pattern hold across retail trading? The evidence at this point is incomplete, but figures from Saxo Bank point to large declines in retail Forex trading, too.
In February, Saxo Bank reported a monthly Forex trading volume of $92.4 billion, down from $106.7 billion in January and a huge decline from $134.8 billion in December 2023. To highlight the significance of this drop in volume, February 2024 was the first time Saxo Bank had reported a monthly Forex trading volume of under $100 billion since December 2021.
Interestingly, total trading volumes across all assets at Saxo Bank have remained about the same over this period. Traders are still trading – they’re just not trading Forex. Why is this? Well, Chris Weston Head of Research at Pepperstone, one of our favourite brokers for serious traders, thinks he has the answer:
“…at the moment, currency forecasting seems more difficult than usual. Not because… divergences don’t exist – they do! – but because the divergences in question have all seemingly been well-discounted. This, then, results in the turgid, quiet, and frankly dull trading conditions that we’ve seen across the G10 board of late; tight ranges, lacklustre moves, and generally low levels of vol[ume].”
Watching the Fed
So, with the major pairs trading broadly sideways, it seems that traders have moved their attention to asset classes with higher volatility, such as stocks, commodities, and cryptocurrencies. But what will bring traders back to the market? As is often the case in the Forex market, the answer lies with the US Federal Reserve.
While the European Central Bank (ECB), the Saudi National Bank (SNB), and the Bank of England (BoE) have all shown signs that they may begin cutting interest rates sooner rather than later, all eyes will remain on the FOMC and when it starts to lower rates.
While rate cuts by other central banks may introduce limited volatility (and volume) into the market, the Forex markets will truly spring back into action only once the Federal Reserve begins its cycle of rate cuts.
Technical Analysis
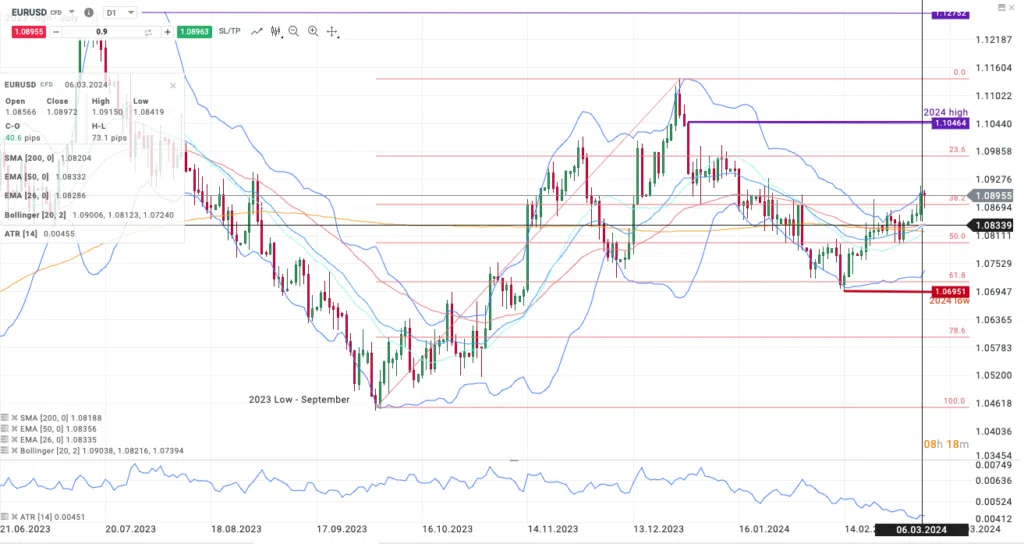
Since the beginning of the year, the EUR/USD has experienced a maximum volatility of 0.0070 on the 14-period Average True Range (ATR) on the 5th of January 2024, and ranging between 0.0054 and 0.0049, since mid-February. This is the lowest volatility we’ve seen on the pair since September 2021.
The Bollinger Bands also reflect this lack of movement in the markets, with the bands remaining narrow since mid-January. To put it into perspective, the pair’s highest price was 1.1046 on the 2nd of January 2024, and its lowest price was at 1.0695 on the 14th of February 2024, which translates to an overall price difference of only 351 pips for the period, with small price movements in between.

Although the pair has been in a long-term downtrend since the beginning of the year, the rising peaks and troughs suggest the progression of a tentative uptrend. Hovering above all three moving averages, and the Fibonacci 38.2% level (from the September 2023 uptrend), the next target for the bulls will be the Fibonacci 23.6% level at 1.0985, and above this, the 1.1000 psychological handle.
On the downside, the moving averages are currently acting as support at the 1.0833 level. Any moves below this level could see 1.0800 come into focus, and below that, 1.0796 at the 50% Fibonacci level.
Stay updated
This form has double opt in enabled. You will need to confirm your email address before being added to the list.


