-
Best Forex Brokers
Our top-rated Forex brokers
-
Brokers for Beginners
Start trading here
-
Forex Demo Accounts
Learn to trade with no risk
-
ZAR Trading Accounts
Save on conversion fees
-
Lowest Spread Brokers
Raw spreads & low commissions
-
ECN Brokers
Trade with Direct Market Access
-
No-deposit Bonuses
Live trading with no deposit
-
High Leverage Brokers
Extend your buying power
-
Islamic Account Brokers
Best accounts for Muslim traders
-
Market Maker Brokers
Fixed spreads & instant execution
-
All Trading Platforms
Find a platform that works for you
-
TradingView Brokers
The top TradingView brokers
-
MetaTrader4 Brokers
The top MT4 brokers in SA
-
MetaTrader5 Brokers
The top MT5 brokers in SA
-
cTrader Brokers
The top cTrader brokers in SA
-
Forex Trading Apps
Trade on the go from your phone
-
Copy Trading Brokers
Copy professional traders
As I discussed last week, after an incredibly quiet start to the year, the Forex market remains in the doldrums – with no real volatility expected until the needle starts to move on interest rates. That said, Yannis Stournaras, the head of the Central Bank of Greece, gave traders a glimmer of hope this morning. In an interview, he argued that 30% of tightening had yet to filter into the EU economy and that:
“We need to start cutting rates soon so that our monetary policy does not become too restrictive. It is appropriate to do two rate cuts before the summer break, and four moves throughout the year seem reasonable.”
His comments caused a brief drop in the EUR/USD before prices recovered.
But in the current climate, two rate cuts before the summer seems unlikely. Indeed, the European Central Bank (ECB) Chief Economist, Philip Lane, was also talking on Thursday morning. He said “we need to take our time” to get rate cuts right and that the ECB would “learn a lot by April, a lot more by June.”
I expect most ECB policymakers to agree with Philip Lane’s more cautious approach. With the Fed’s hawkish stance seemingly vindicated by strong US economic data, I fear that Forex traders will need more patience before volatility returns to the market.
OPEC and IEA at loggerheads as crude prices climb
Away from Forex, crude oil prices climbed steeply on Wednesday and Thursday, with WTI prices topping $80 for the first time since November 2023. Prices have been supported by the Russian invasion of Ukraine and the crisis in the Middle East, especially its effects on global shipping. With neither conflict showing signs of abating, prices could remain elevated for some time.
However, the spike in price on Wednesday and Thursday stems from a surprise decrease in US stockpiles and the publication of OPEC’s demand prediction report. OPEC forecasts that 2024 will see overall demand increase by 2.2 million barrels per day, with a 1.8-million-barrel increase in 2025. It’s worth noting that OPEC is not an impartial source, and this forecast has been met with scepticism, most notably by the International Energy Agency (IEA) itself.
In the IEA’s own demand report published in February, it forecast an increase of only 1.2 million barrels per day in 2024 – a difference of 1 million barrels per day from OPEC’s figures. This is the widest divergence we have seen in forecasts from the two institutions in 16 years, and one of them will be very wrong.
Oil prices will remain supported while the twin conflicts in Ukraine and the Middle East continue. Still, any sustained sign of weakness in the US economy could have a dramatic effect – bringing the IEA’s forecast into focus.
EUR/USD Technical Analysis
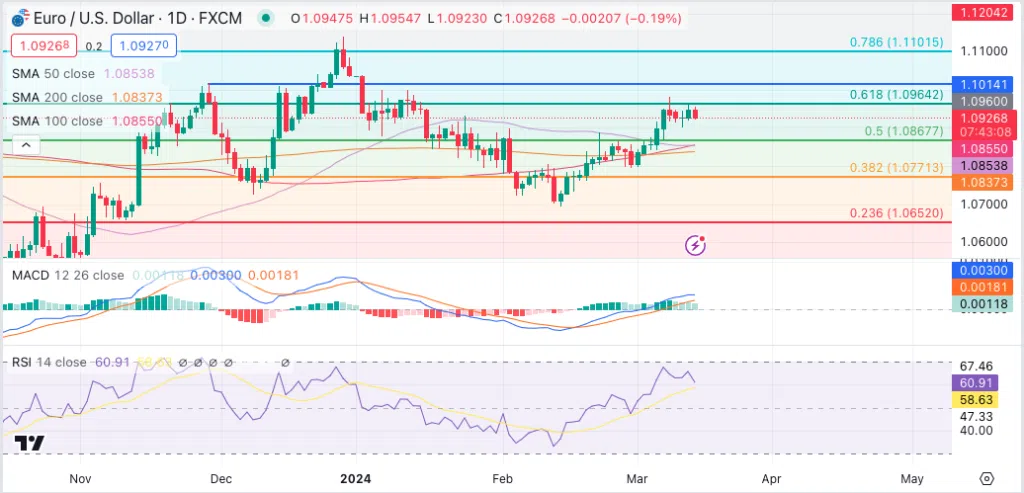
Following Stournaras’ statement on Thursday morning, the EUR/USD dropped, but recovered shortly afterwards. After nearly a month of bullish moves, the pair again lost momentum and has been trading in a tight range around the 1.0930/1.0940 zone, respecting the 61.8% Fibonacci resistance level (of the July to September 2023 downtrend).

Although price remains above all three simple moving averages, the 50-day SMA (purple) appears to be crossing over the 100-day SMA (pink), further indicating price consolidation. The pair’s low volatility reflects the relatively uneventful news week. Should a bullish breakout occur, a move above 1.0960 could see the target of 1.1014 come into focus, and beyond that, 1.1101. A bearish breakdown may find first support at 1.0901, and below that at 1.0867.
Crude Oil Technical Analysis
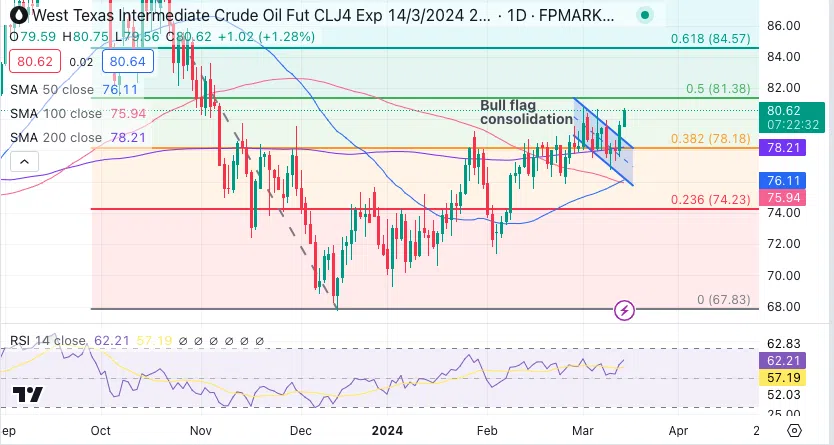
After having hit a low of around 67.70 USD mid-December 2023, oil has been in an uptrend ever since. The price attempted to break the 80 USD psychological barrier multiple times over the last 10 days and appears to have finally succeeded. From a purely technical perspective, the bulls look strong, with the 50-day SMA (blue) crossing above the 100-day SMA (pink).

Price also seems to have moved above a bull flag consolidation pattern (blue channel lines), indicating further upside moves. Additionally, the RSI sits above the 50 level but is not yet in oversold territory. Having broken through 80 USD, the level now provides immediate support, but failure to close the day above this level could see sideways consolidation. Further downside moves would find support at 79.55 USD. Immediate resistance will be experienced at the 80,84 USD (last week’s high) and further up at the 81.3 USD level (corresponding with the 50% Fibonacci retracement)
Stay updated
This form has double opt in enabled. You will need to confirm your email address before being added to the list.


