-
Best Forex Brokers
Our top-rated Forex brokers
-
Brokers for Beginners
Start trading here
-
Forex Demo Accounts
Learn to trade with no risk
-
ZAR Trading Accounts
Save on conversion fees
-
Lowest Spread Brokers
Raw spreads & low commissions
-
ECN Brokers
Trade with Direct Market Access
-
No-deposit Bonuses
Live trading with no deposit
-
High Leverage Brokers
Extend your buying power
-
Islamic Account Brokers
Best accounts for Muslim traders
-
Market Maker Brokers
Fixed spreads & instant execution
-
All Trading Platforms
Find a platform that works for you
-
TradingView Brokers
The top TradingView brokers
-
MetaTrader4 Brokers
The top MT4 brokers in SA
-
MetaTrader5 Brokers
The top MT5 brokers in SA
-
cTrader Brokers
The top cTrader brokers in SA
-
Forex Trading Apps
Trade on the go from your phone
-
Copy Trading Brokers
Copy professional traders
A Fakeout is a breakout of an important technical level that fails to continue in the expected direction of the breakout. Trading fakeouts or, trading false breakouts, is an aggressive trading strategy. If the market gets near a technical level that has not been broken for a while, and then pushes through it, it doesn’t necessarily mean that the market is going to carry on in the direction of the breakout. Actually, the market is more prone to make false breakouts than genuine breakouts. False breakouts are common, and many technical traders have fallen for them in the past and find themselves caught on the wrong side of the market.
How to Trade Fakeouts
Understanding how to trade false breakouts is easy once you grasp two crucial trading principles:
- There must be a clear support/resistance level where traders can look for false breakouts.
- Always wait for the breakout candlestick closing price for making the trade.
The breakout candle is the most important factor in identifying the difference a false breakout and a true breakout. If the breakout candlestick fails to close above the resistance level or below the support level, then this is the first sign that we are watching a false breakout develop. 
Trade Fakeouts Against The Dominant Trend
For more consistency and a higher win rate in trading fakeouts, trade false breakouts in the opposite direction to the dominant trend.
- In an uptrend wait for pullbacks into support and wait for a false breakout to occur at this support level.
- Inversely, if we’re in a bearish trend wait for a retracement into a resistance level, and hold back until a fakeout around this level occurs.

It’s also important that you only trade fakeouts at obvious and proven support and resistance levels.
Enter After the Breakout Candle Closing Price
The best entry strategy is to enter right after the breakout candle closing price. The advantage of this entry technique is that it will give you a tight stop loss while the potential profits can be exponentially larger. You can literally trade false breakouts not just off of support and resistance levels, but against any other technical levels or price action patterns.
Watch the Trendline
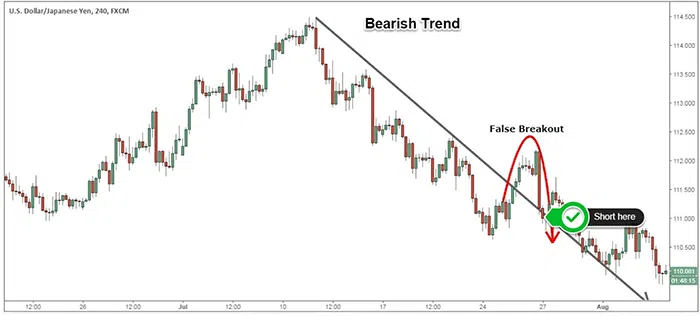
Another common technical tool that is prone to false breakouts is the trendline. In the example below, the USD/JPY bearish trend can be contained inside a downward trendline that at one point gets broken. The prevailing trend seems more powerful and the trend resumes to the downside. The moment we close back below the trendline that’s a good entry signal if you want to ride the trend.

USD/JPY bearish trend can be contained inside a downward trendline that at one point gets broken
When you see a fakeout move against the prevailing trend like the one in the USD/JPY chart above, it’s a good signal that the prevailing trend is about to resume. Trading fakeouts are more suitable for short-term to medium-term trading even though false breakouts can also be found at the beginning of a new major trend.
Conclusion
Fakeouts can happen in all types of market conditions (trading, consolidation, reversing) and it can be a valuable tool that can signal possible changes in the trend direction or confirm the trend. Identifying fakeouts can offer good trading opportunities if you have a good strategy to attack them with. If you’re able to identify clear support and resistance level and have the patience to wait for the market to produce a false breakout you can succeed with this strategy. The critical thing is to be able to identify the key elements prior to the false breakout and take full advantage of the opportunity to profit while limiting your risk effectively.
Stay updated
This form has double opt in enabled. You will need to confirm your email address before being added to the list.


